Table of Contents
What are institutional dashboards?
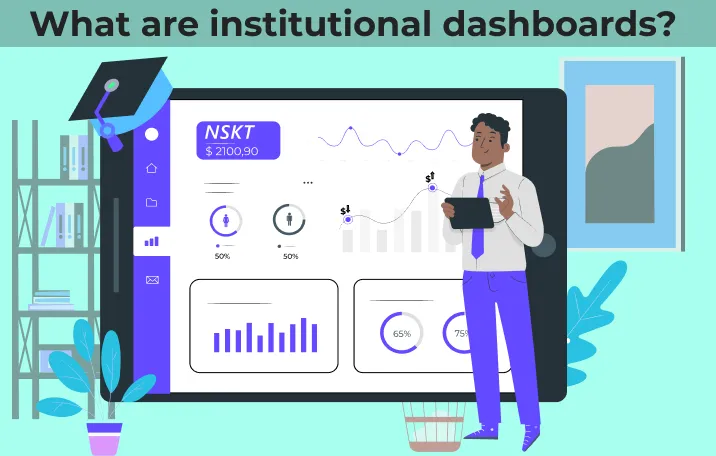
In this age when information and data are readily available, it becomes critical for institutes offering higher education to develop tools that can be used to convey important information to those who are responsible for making decisions that can be readily understandable to all. One of such tools available for making ready-to-understand decisions is a dashboard. It is a document of one or two pages that contains critical information in a simple and visually appealing format. An institutional dashboard is designed in such a way that helps the college or university management guide the organization. Or it can also be called a key element of an organization’s mission, vision, and strategic direction which can be used to navigate or monitor the organization. The institutional dashboard for a college or university is a management tool that briefly explains and informs the viewers regarding the current state of affairs, provides information that can be used to evaluate the performance of the organization by the viewers, and thereby helps improve the decision-makers process of the institution.
The main characteristics of performance dashboards include:
- Usage of visual components such as charts, gauges, performance bars, maps, stoplights, etc to highlight the data and exceptions that require action;
- Data is gathered from a variety of sources;
- Enables drill-down or drill-through to underlying data sources;
- Refreshes the data timely to presents a dynamic, single view of the business
- Contains effective financial metrics
- Display key factors of the performance indicators in a concise, intuitive format;
- Helps monitor individual business unit, and organizational performance and processes for a better understanding of the business;
- Is not always based on Portal;
- Is easy to use.
Problems faced by colleges and universities before visual dashboards were introduced
Earlier, when dashboards were not introduced there, were several problems faced by universities and colleges which really affected the performance of the students as well the institution. Some of the common problems include:
- There was no proper reporting of problems faced by students which resulted in their bad performance academically.
- There was no record of the student’s performance or personal information which was needed for maintaining the student’s record
- The institution didn’t have a proper visual picture of their performance which can be shown to the higher management.
- Without a visual dashboard making informed decision took a lot of time
- Meeting compliance reporting requirements were not easy
- Planning long term development goals were difficult for the university and college without the help of a visual dashboard
- As there was very little record of the student’s performance providing them more educational opportunities became a tough job.
But once visual dashboards came into view everything changed and came in place. Some of the advantages of using Visual dashboards over normal reporting are:
- A straightforward way to monitor the performance of the institution
- It is an easy way to understand all the parameters
- Visual dashboards are considered an engaging format of data presentation to communicate all the essential information
- It can be used to present data at all the levels of the institution such as department wise, students wise, division wise, etc.
- Provides metrics on all the KPIs that represent the goal of the institution, issues, and operations.
Most colleges and universities have large and complex structures. In order to manage the data effectively, these structures have been divided into several sectors and segments such as based on faculty or department. Several factors such as the admission of students, teaching load, rates of graduation, and funds for research works. This all affects the performance of the college or university. It is a must for the Universities to capture and report the data on all levels. One of the most challenging things for colleges and universities is to manage the development and deployment system. Some important KPIs for colleges and universities that need performance management include Finance, research, student teaching and learning, and human resource.
How data visualization has helped different KPIs in Colleges and Universities
KPIs or key performance indicators are data elements that measure core inputs, outputs, and outcomes. They help reflect the core business of the institution as well as a strategic plan. KPIs also help in measuring the operation of the institution which is of high priority. It helps in measuring the institutional performance in areas that are a must for the University or college to survive in the competition or be successful. Some of the prominent KPIs of colleges and universities are:
- Student enrollment- Visual dashboards help in identifying the number of students being enrolled and the basis of their enrollment using a visual representation of the data. It also compares the data based on previous years’ data.
- Students’ attendance- One of the major factors that need a lot of attention is the students’ attendance. This is the basis for calculating the performance of the students. Visual dashboards represent this data in an easily understandable format which will help assess the attendance of all the students.
- Students’ progress- This KPI includes Fall-to-fall persistence as well as Term-to-term persistence. This helps in analyzing the performance of the student periodically or annually. It also helps in knowing the result of certain training given to the students.
- Students’ retention- Retention of students is a very common thing in colleges and universities. When students don’t perform well or take things seriously they are bound to get retention in the same year of education. Visual dashboards help in knowing the reason behind the retention of the student.
- Marketing- It is one of the important KPIs that help institutions become more of a business-like thing in the competitive scenario. Visual dashboards have information regarding all the marketing techniques used by the institutions and the advantages and disadvantages of using such marketing methods.
Advantages of using performance dashboards by Colleges and universities
Universities and colleges have a large amount of data collected from students during admissions, attendance, financial resources, etc. The main problem is to arrange this data in such a way that it can be easily shown to the higher management and other authorities, who can get a quick insight about the ongoing tasks. This is where performance dashboards work. The dashboards provide patterns and trends in a graphical format to use a reliable approach towards the results.
Given below are some advantages of using performance dashboards:
- Improvement in the decision-making process- The performance dashboard works as a 'Navigation Reporting Tool'. It collects the data about the college and university from various sources, combines them, and reports them in such a way that it can be easily understood by all. This helps the higher management get detailed insights and make valuable decisions for improvement in the functioning of the college or university. It addresses several areas such as academic, human resources, students' progress, etc. by gathering trustable data that can help in powerful planning. The dashboard also helps by comparing the data from several years to showcase the performance of the institution in different areas. This helps in predicting the future trends of the institution.
- Tracking Student's retention and Admission With visual Dashboards- Nowadays most colleges and universities are facing an increase in dropout students. Moreover, the government pays lesser funds for repeat students to the Universities. This makes it mandatory to plan student retention and tracking strategy. The admission management system in the performance dashboard automates the entire procedure of the admission and allows administrators to store student’s academic, personal, and fee-related data on an online platform that is secure. Student information management system helps in maintaining students’ records of each and every day. A performance dashboard is a safe and secure way to store data and also helps in increasing transparency among all stakeholders.
- Manages methodology of education and monitors students- It is also very much important to keep a note on the performance of the students. The performance dashboards for universities and colleges include the key performance indicators that keep the administration informed about the students’ progress and their engagement in academic things. Furthermore, the effectiveness of the courses can also be assessed using the dashboards. The performance dashboard shows the report of the students’ progress which gives an overview of the student’s academic performance and attendance.
NSKT Global is a top data analytics firm that helps organizations get real information on all the respective aspects of increasing their business performance. We provide information to colleges and universities regarding performance dashboards and also help them get the required tools for improving the performance or increasing the student’s enrollment.


