Table of Contents
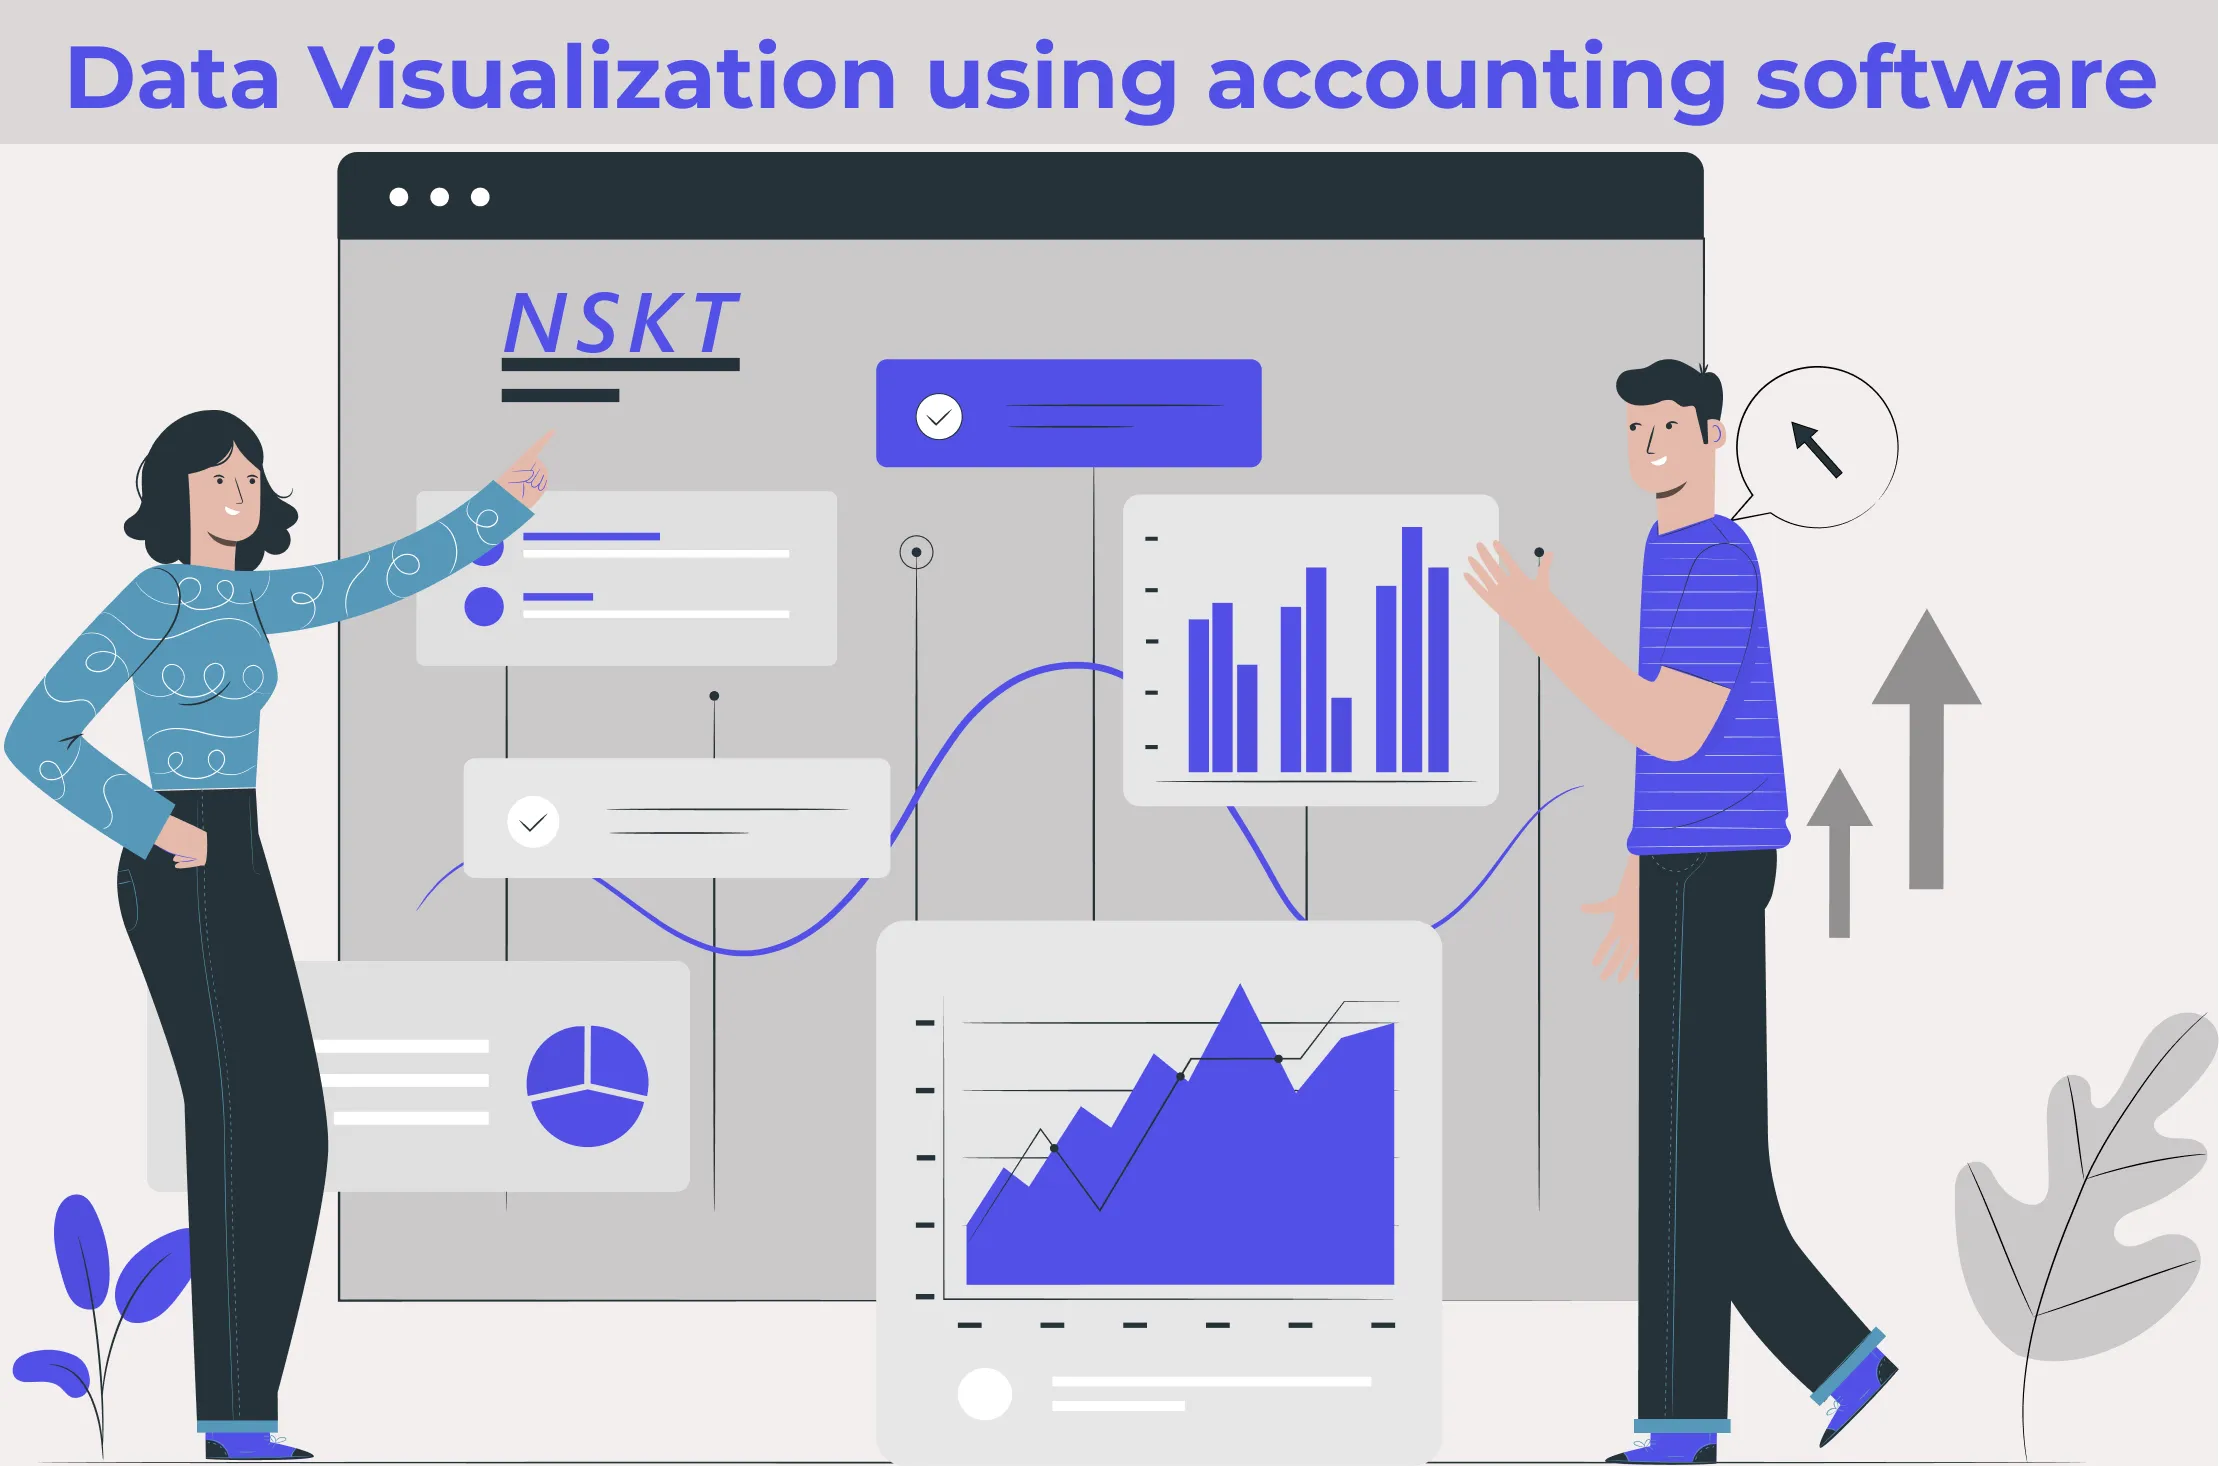
Data visualization is the graphical representation of any kind of data and information. This is done by using visual elements such as charts, graphs, and maps. Tools used for data visualization provide an easily accessible way to see and understand trends, outliers, and patterns in data. In today’s world when the data is huge in number, data visualization tools and technologies are essential to analyze massive amounts of information and make decisions data-driven. Data visualization makes it more helpful for investors, shareholders, managers, and other interested parties, to make decisions based on the previous data represented in such a simple and smart way.
Importance of data visualization
Data visualization provides a quick and effective way to communicate the data in such a way that it reaches the end-user in a simple and visual format. It helps businesses identify several things such as factors affecting customer behavior, area of improvement, predict sales volume, and gives several other such messages to the stakeholders. Other benefits of data visualization include:
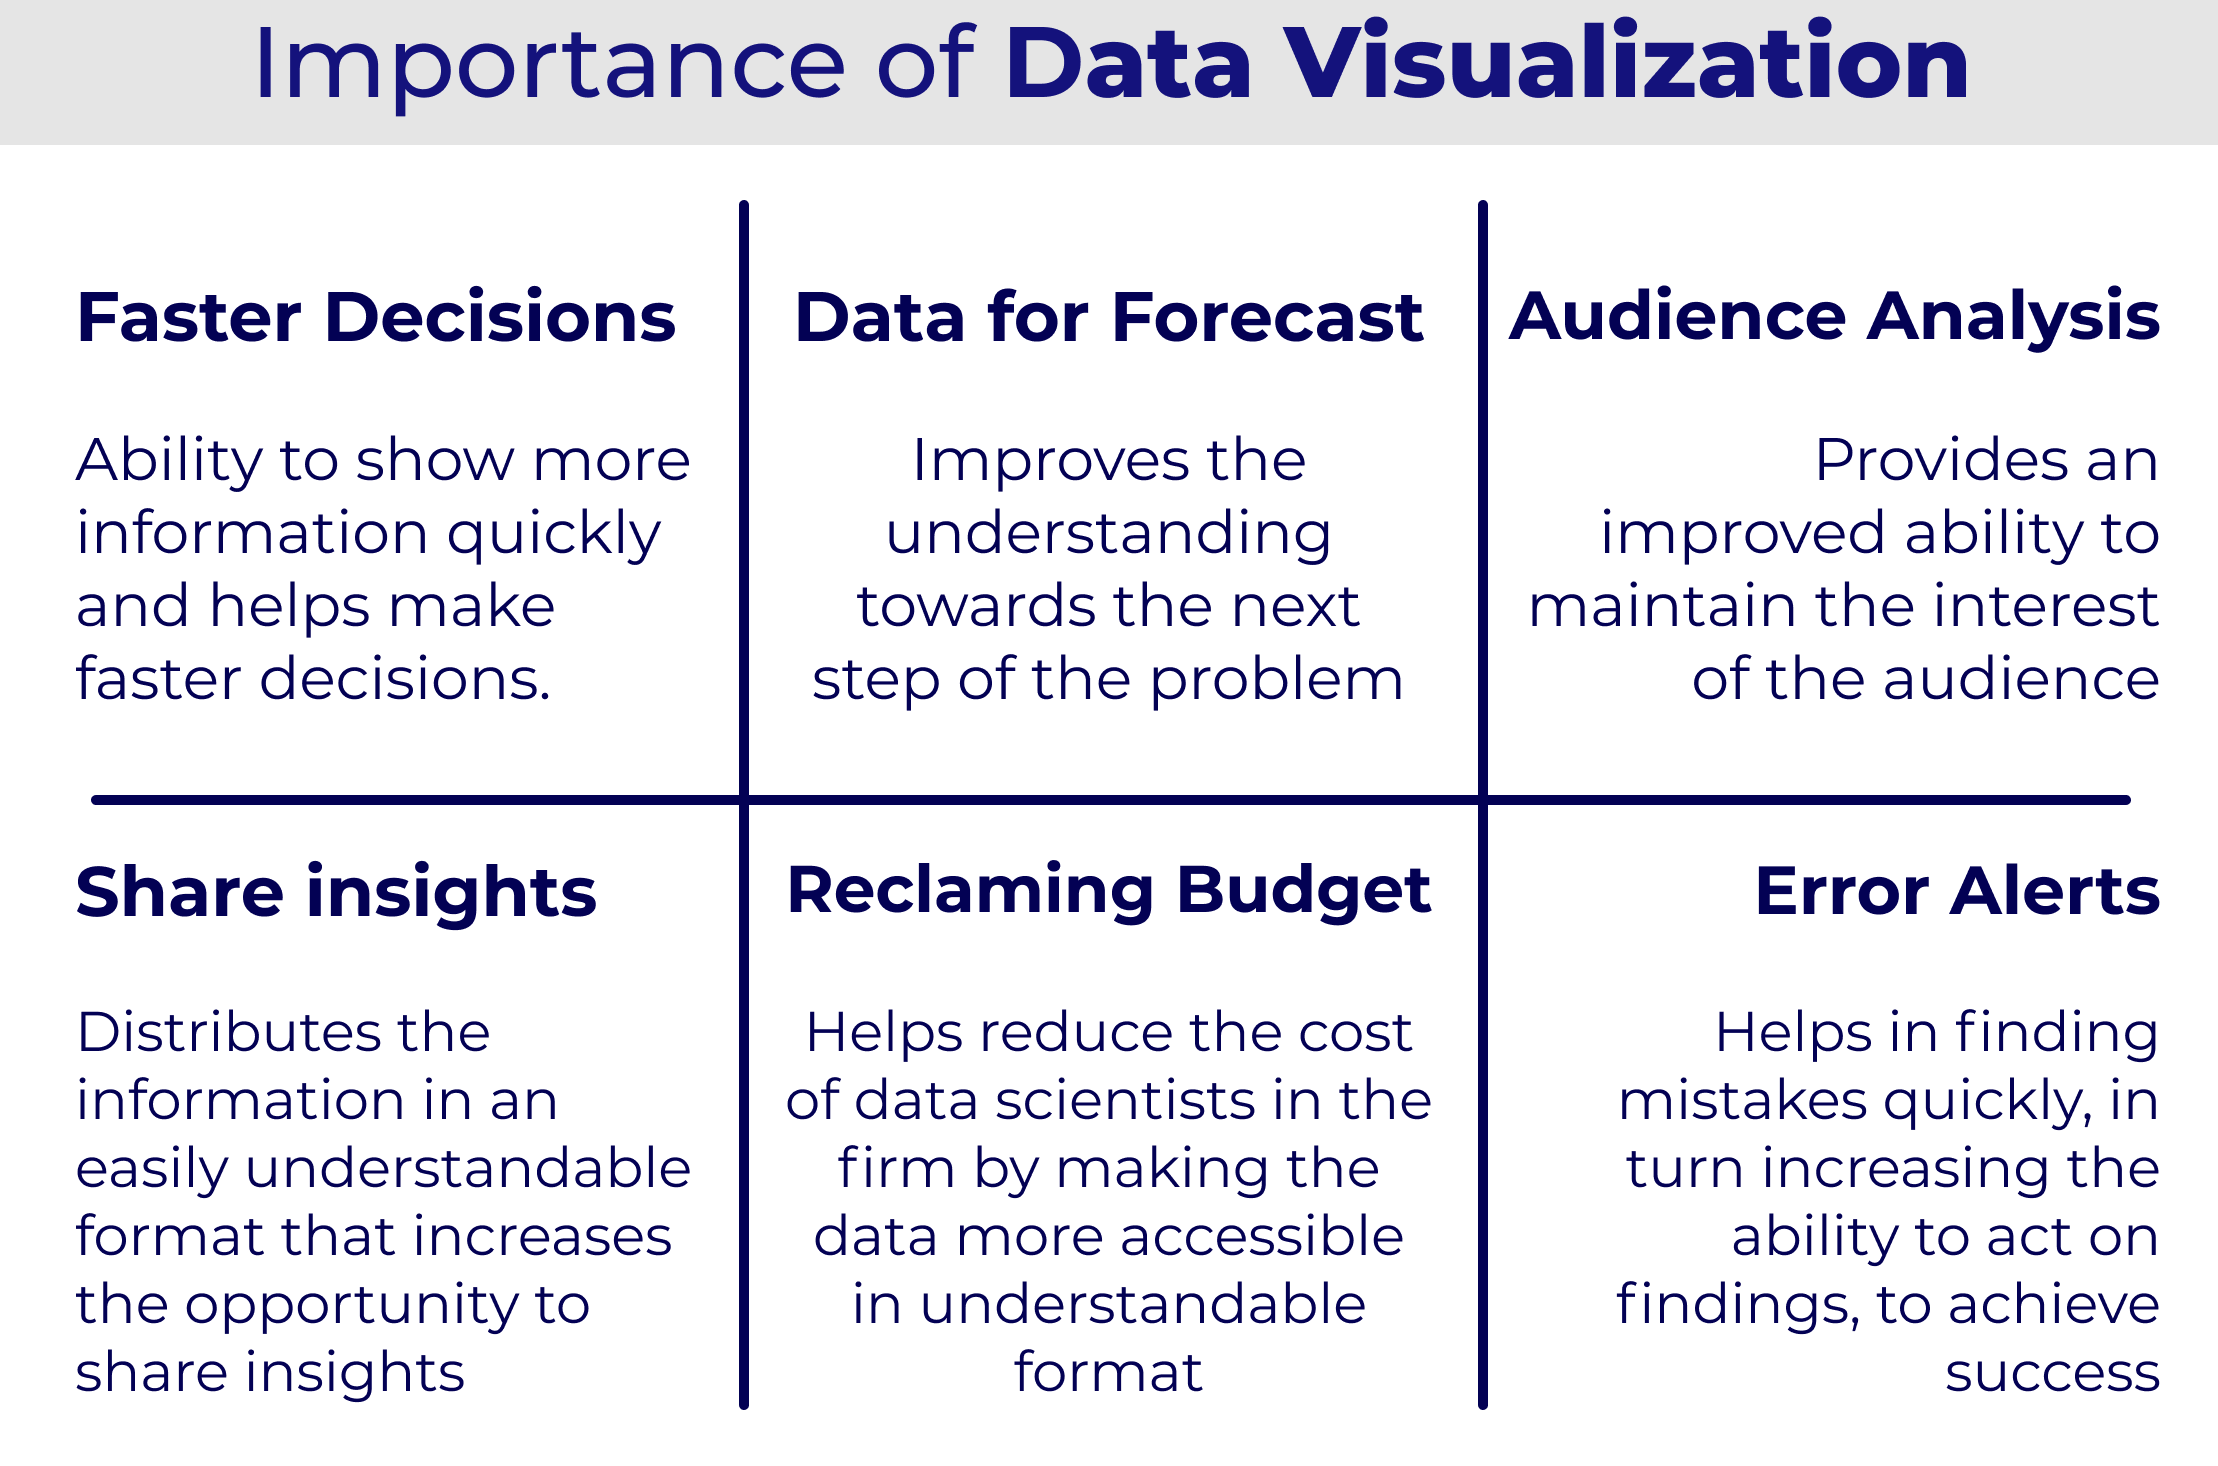
- It has the ability to show more information quickly and helps make faster decisions.
- It improves the understanding towards the next step of the problem to improve the performance of the organization.
- It provides an improved ability to maintain the interest of the audience with the precise information it provides.
- It distributes the information in an easily understandable format that increases the opportunity to share insights with everyone involved
- It helps reduce the cost of data scientists in the firm as it makes the data available more accessible and understandable format
- Data visualization helps in finding mistakes quickly, thus achieving success with greater speed as it increases the ability to act on findings.
Data visualization and big data
There is an increase in demand for big data and data analysis projects have made data visualization more important than ever. Machine learning has been increasingly used by companies to gather huge amounts of data that can be slow and difficult to sort out, comprehend, and explain. Data Visualization works as an aid in solving this problem as it speeds this up and presents the data to business owners and stakeholders in ways they can easily understand.
Data visualization in Big data does not involve typical techniques such as pie charts, histograms, and corporate graphs. Instead, a more complex representation is involved in it such as heat maps and fever charts. Data visualization in big data requires powerful computer systems which collect raw data, process it, and turn it into graphical representations that can be used by humans to draw insights. While there are several benefits of data visualization in big data, it has some disadvantages as well such as:
- In order to get the most from big data visualization tools, there is a need for visualization specialists who must be able to identify the visualization styles and best data sets to guarantee that organizations are properly optimizing and using their data.
- Data visualization in big data always requires involvement from IT and management. As the big data visualization requires efficient storage systems, powerful computer hardware, and even cloud movement.
- The insights given by data visualization in big data will be as accurate as it has been visualized. Therefore, it is important to hire employees to look after the control and quality of corporate data, metadata and data sources.
Account analytics and tabular reporting
Account analytics is the collection of financial data statements from the accounts and examining them in Big data using data science or data analytics. This is usually done to help answer the queries related to accounting. The representation of the same data in descriptive statistics in a table format is called tabular reporting. Tabular reporting helps the user by placing the data into multiple classes or categories for accounting analysis and statistics calculation such as counts, sums, means, and percentages on these classes.
Data Visualization limitations in Quickbooks and Xero
Quickbooks and Xero have enduring viability in accounting. The bookkeeping and spreadsheet functions in these accounting softwares work as a great tool for accountants worldwide. However despite getting several updates both Xero and QuickBooks show their limitations when they’re used for data visualization.
- A major disadvantage of Quickbooks and Xero is the challenge of analyzing real-time unstructured and semi-structured data in it.
- You can create dashboards in Quickbooks and Xero, but the dashboards created are static which only shows high-level trends and serves as a conclusion for further exploration.
- Data kept in Quickbooks and Xero are stale. The moment a CSV file is imported and a worksheet is built, data becomes out of date as it doesn’t connect to a live data warehouse. This forces users to go for manual processes and report the data over and over again.
- Quickbooks and Xero make it difficult for the teams to share, collaborate, and discover answers efficiently, and can ultimately put companies in a position of disadvantage.
Data Visualization dashboards
A data visualization dashboard is a tool that helps in the management of information. It also tracks, analyzes and displays key performance indicators (KPI), metrics, and key data points to monitor the health of a business, department, or specific process. They can also be customized as per the needs of the specific department and company. Data visualization tools help the business in the following ways:
- Dashboards focus on presenting analytical and operational data- Analytical dashboards are basically designed to help executives, decision-makers, and senior leaders of the business set goals, establish targets, and understand the performance of the business in the past as well as in the future. They can use the same information to implement appropriate changes.
- Dashboards present interactive data visualizations- Data on a dashboard is visualized in form of tables, bar charts, line charts, and gauges so that users can track the health of their business against benchmarks and goals. Data visualization dashboards present the most important data of the business through visual representation which gives a clear message to the business owners regarding the future of the business.
Wrap up
We require data viewing since the human brain is not well adapted to consume so much raw, disorganized and comprehensible information. To convey data results, we need graphs and charts so that we can discover patterns and trends to gain insight and make better choices faster. At NSKT Global, we provide consultancy services to convert tabular reporting into Performance Dashboards. We are certified Quickbooks pro advisors who help clients in all problems. NSKT Global is a top data analytics firms with the best data analyts, accountants and CPA on board.
DEMO A Data Visualization dashboards here
We comprehend in analysis the value of data visualization and its significance for our clients. We provide clients with user-friendly and appealing viewing options and tools for clearly and meaningfully representing their data. We are here to guarantee our clients are able to make rapid, educated, and easy-to-interpret decisions based on reliable facts.


